What is iot?
iot is a Linux application program that inserts the I/O toolkit middleware into the environment of all child processes of iot. iot has several options that allow for customizable instrumentation.
Benefits
Examples
iot command is a pre-command, such as time:
% iot -f dd.icf dd if=/dev/zero of=/dev/null count=1024 bs=1m
iot arguments
-f <icf_file_name>
-c <file> collect all ilz streams in a single file
-m <mpi flavor> valid flavors are mpich, mpt, ompi
Processes downstream of the iot process are selectable for instrumentation, based on the pathname of the program being executed, by directives in an iot configuration file (icf):
PROGRAMS.include={"*.exe:a.out"}.exclude={"sh:csh"}
icf example
ilz.name={PROGRAM+"."+PID}
PROGRAMS.include={"*.exe"}.exclude{"/bin/*"}
diskstats.interval={500}.devices={"sd*"}
meminfo.interval={500}
FILES.include={"/tmp/**"}
LAYERS.use={trc,psx}
What is Pulse?
Pulse is a Java graphical application that imports ilz streams and allows the user to view and manipulate the imported data. Pulse has several features that facilitate the analysis of data:
NOTE: The largest ilz stream processed by Pulse consisted of 2 tables of 28.6M posix reads and writes, requiring only 2.3GB of memory by the JRE
How are Instrumentation Streams used?
File I/O instrumentation for each program is selectable on a per-file basis, based on each file's pathname, by directives in an icf file:
FILES.include={*.dat:/tmp/**}.exclude={/scratch/**}
LAYERS.use={trc,psx}
Resulting instrumentation is recorded in an ilz file.
ilz streams are:
There are 3 levels of file I/O instrumentation
Statistics, for each selected file, are summed into a one line summary for the process
trc.detail=0 produces the following for every program
# date time host user pid program bucket openCount closeCount write(count,bytes,wait) read count,bytes,wait)
03/12/15 12:31:26 shemp bauerj 30168 cc1 program_to_psx 192 192 113 547 0.00 191 1219977 0.00
Statistics, for each selected file, are output to the ilz file.
trc.detail=1 produces the following for every file
iosim.exe.21016.ilz trc program_to_cache /mnt/raid0/bauerj/iosim/20992/merged/kubota.SCR300 58224 7630618624 8.43
iosim.exe.21016.ilz trc size(open,close,max)=0,0,460980224  fsType=EXT2 sector=8192
iosim.exe.21016.ilz trc write         8818 1155792896     1.50
iosim.exe.21016.ilz trc read         49399 6474825728     4.15
iosim.exe.21016.ilz trc ftunc            5  948043776     2.79
Blow-by-blow details of each I/O event, for each selected file, are logged in the ilz file.
trc.detail=2 provides tables such as the following for each posix I/O event for each file, in addition to the per-file summary information from trc.detail=1
POSIX
For example, the details for a POSIX read are:
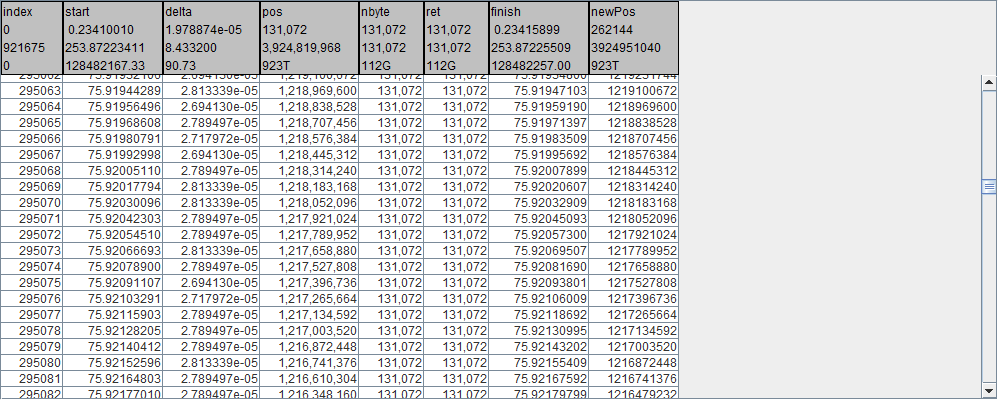
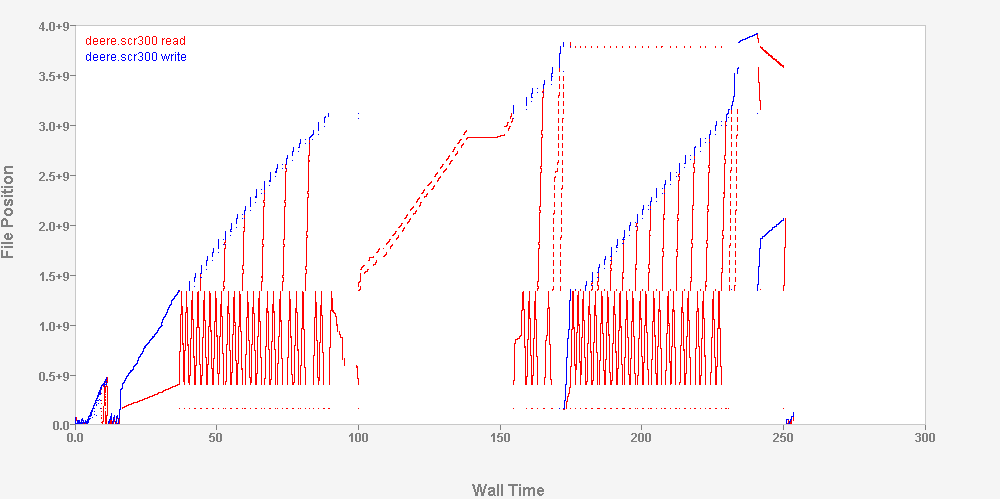
Visualized in Pulse
Global Probe Instrumentation
meminfo
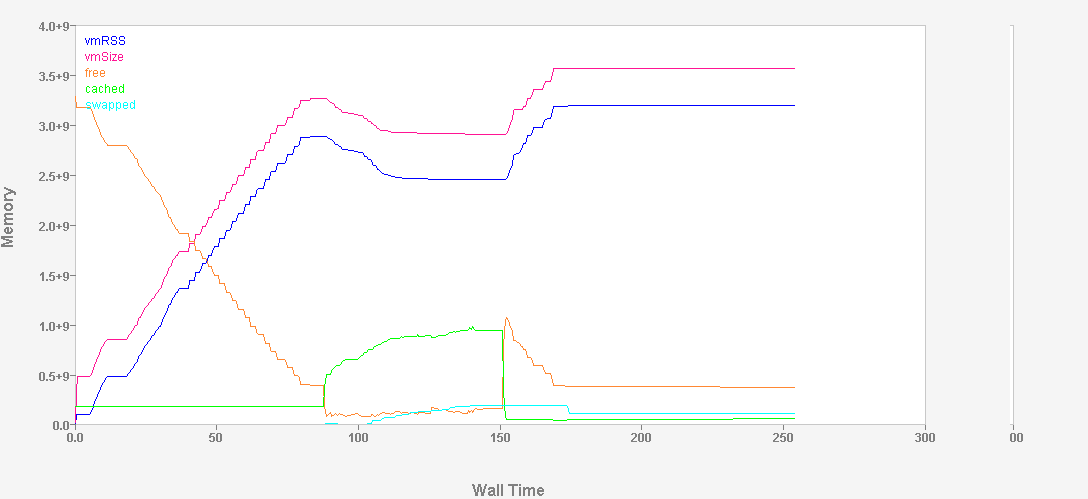
Memory information for a program being instrumented can be enabled with a directive in an icf file:
meminfo.interval={500}The above requests the following memory related details be logged to the ilz file at an interval of 500 milliseconds.
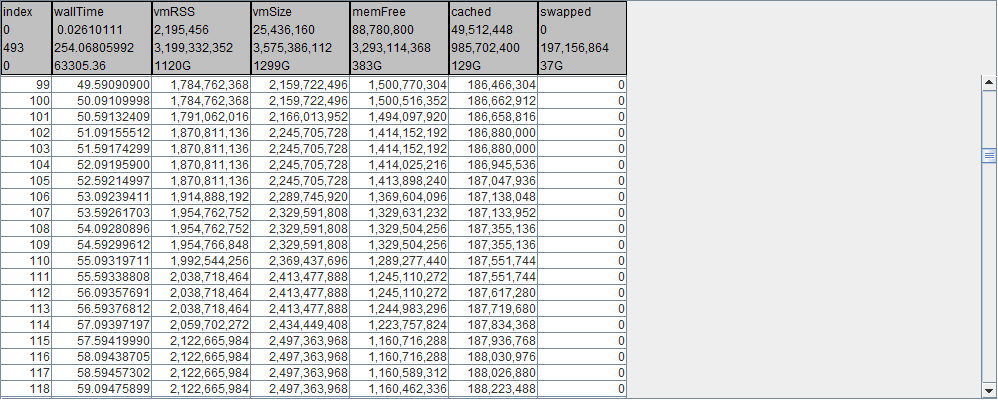
Visualized in Pulse
diskstats
Disk statistics information instrumentation, as reported in /proc/diskstats, can be enabled with a directive in an icf file:
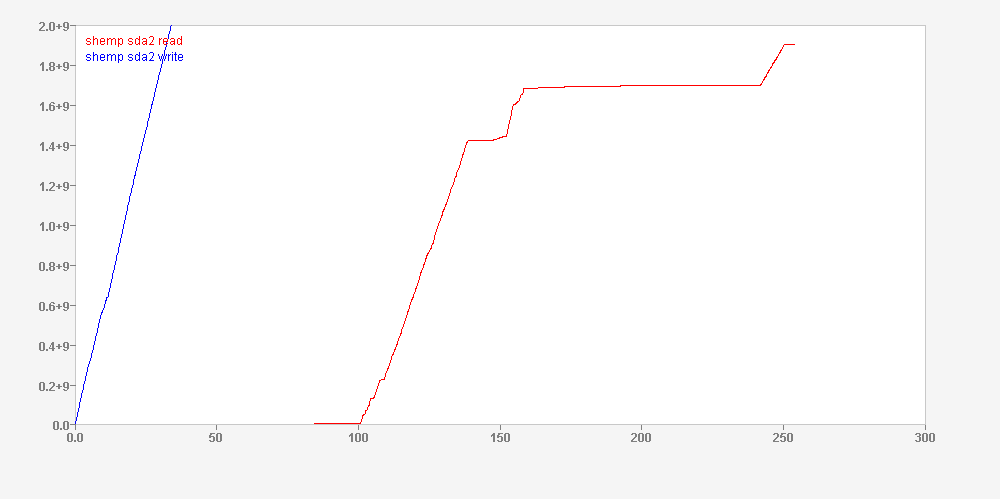
diskstats.interval={100}.devices={sd*}The above requests the following diskstats related details be logged to the ilz file at an interval of 100 milliseconds. For each selected device, both a read table and a write table are generated.
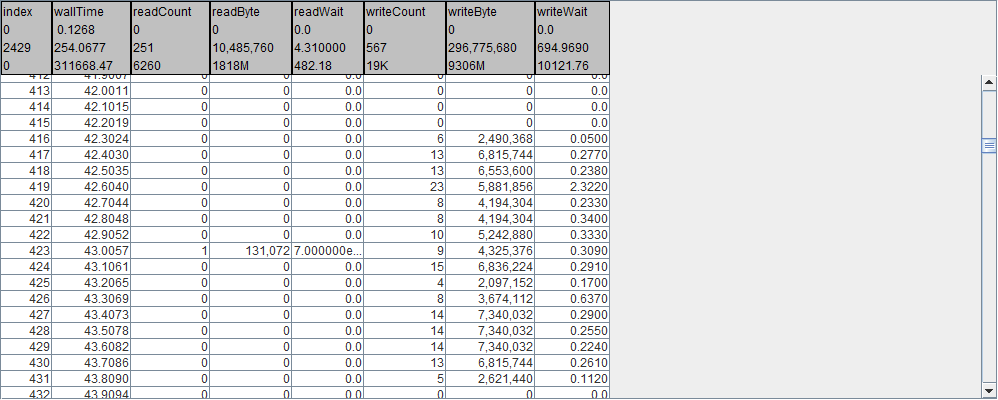
Visualized in Pulse
Lustre OSC statistics
Lustre client OSC usage statistics, as reported in /proc/fs/lustre/osc, can be enabled with a directive in an icf file:
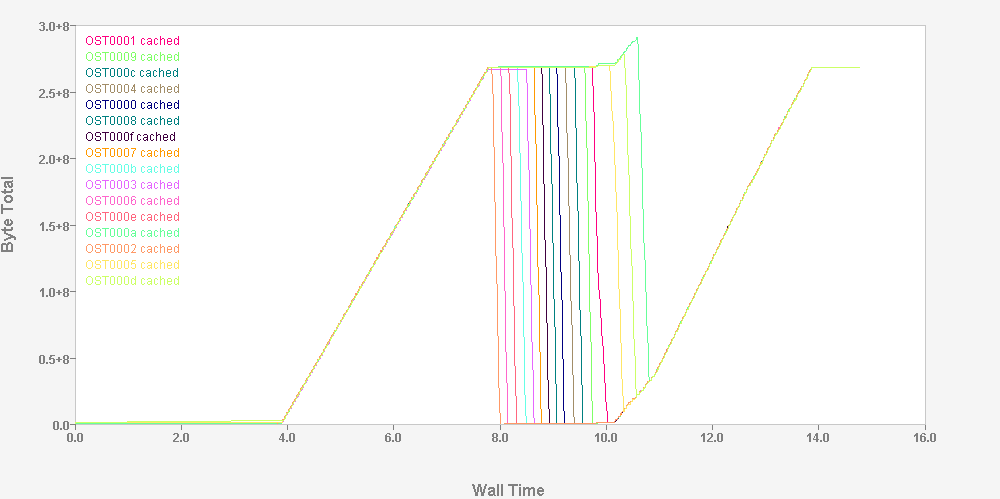
lfsstats.interval={10}.devices={snx*}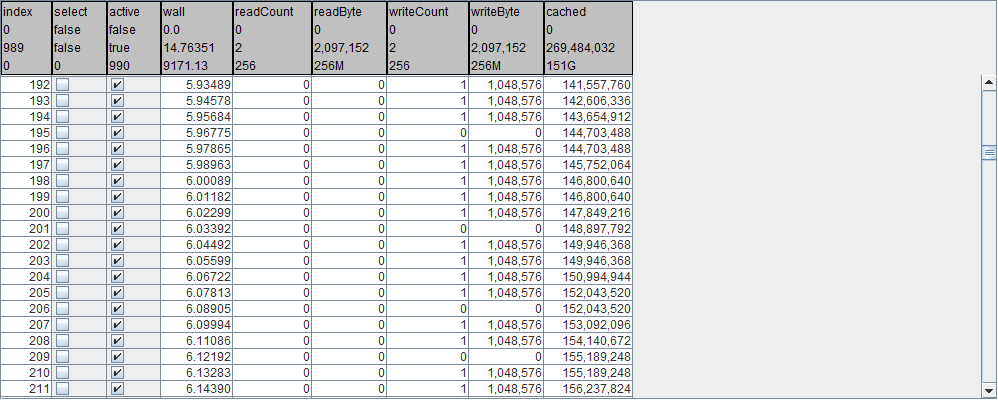
Visualized in Pulse
Lustre fiemap
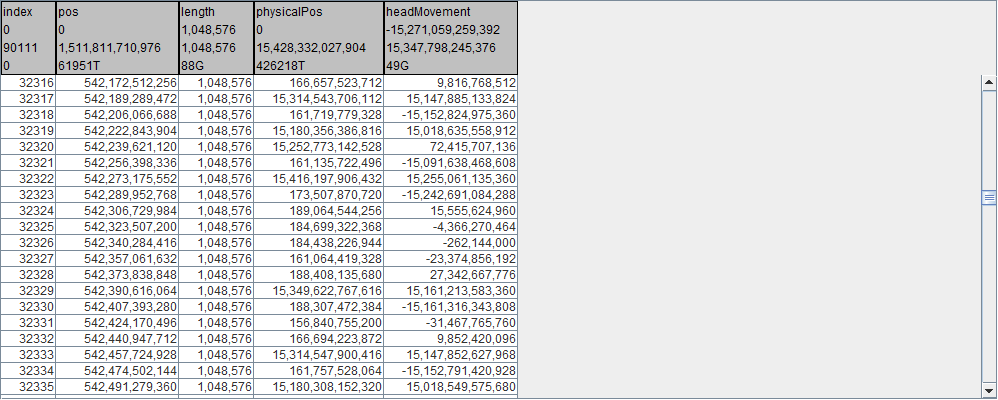
llfie is an iot utility program that generates an ilz file containing the mapping information for a data file stored on a Lustre filesystem. This can be used to visualize how the file is mapped into each OST. Notice in the following table that as the file's allocation position increases, the physical position on the OST oscillates between deep into the OST(~15TB) and back out to the start of the OST(~170GB).
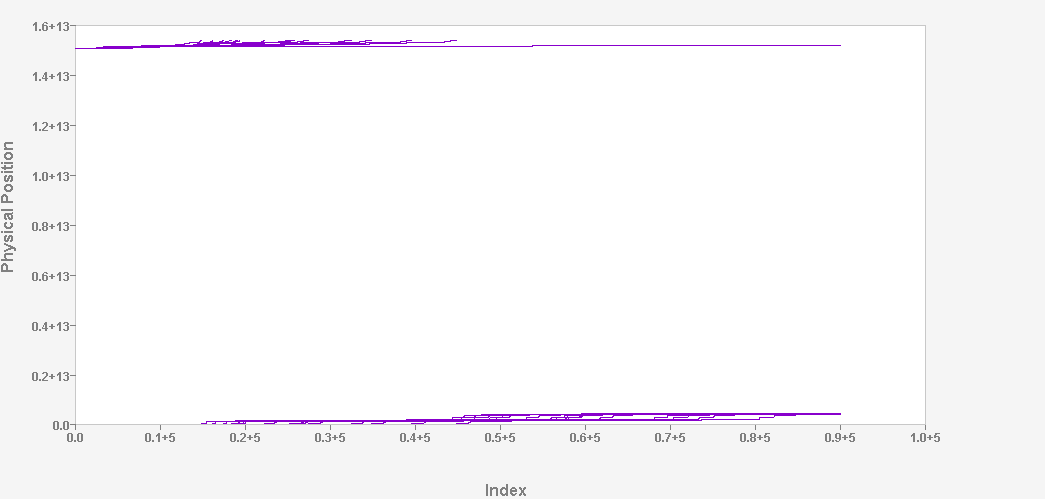
The following plot has "extent number" on the horizontal axis and "physical position" on the vertical axis. This 30,000 foot view of the file allocation shows how the start of the file is generally deep in the OST. The bulk of the file is at the start of the OST.
IOT Optimization Layers
cache layer
The iot cache layer is a user memory cache. Key features are:
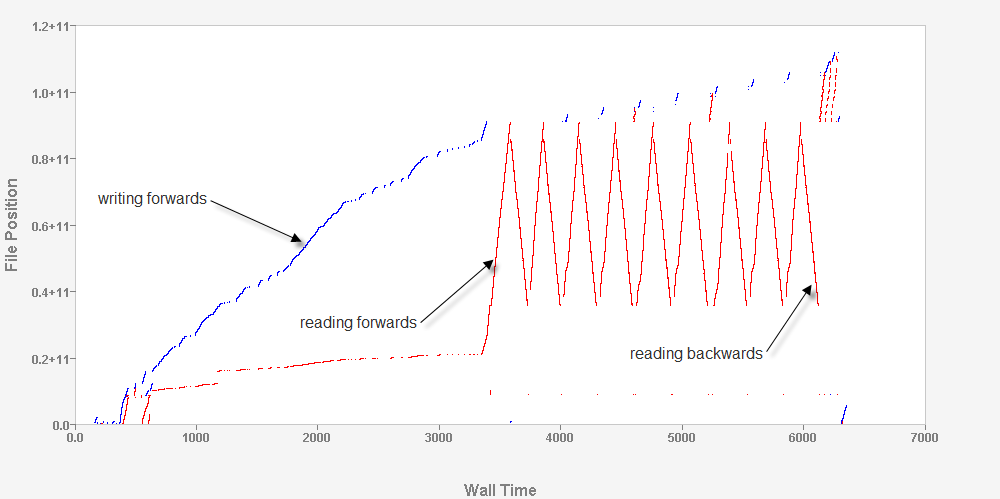
The following image depicts the iot cache in operation, both as a prefetch mechanism and a data reuse mechanism. The grey shaded rectangles represent when a given part of the file is cache resident. The vertical line at the left of the rectangle is the representation of the asynchronous read loading the page. The other red lines are the user program reading data out of the iot cache. At a later point the user program starts reading the file backwards, which has a steeper slope( higher transfer rate), as the data is already cache resident.
paio
The iot paio layer uses pthreads to handle asynchronous I/O requests issued by the iot cache layer. Key features are:
proxy layer
The iot proxy layer is a data transport mechanism. It allows for the transporting of I/O calls, normally made on the local node, to an iot proxy server, ips, running on a different node. The ips then issues the I/O calls on its node. The ips on the server node may also use any of the availble iot layers. This means the ips can have its own iot cache and be used to aggregate I/O calls coming from multiple client processes using the iot proxy layer. Security for the connection to the ips is via ssh. The user process on the client node must be able to ssh, without password, into the server node( where the ips server is to be started or is already running ).